

Top 5 E-Commerce Analytics Tools to Boost Sales


Whether it's thanks to new technology developments, their accessibility and affordability, the rapid adoption of smartphones, or just the convenience online shopping guarantees, the e-commerce industry is booming.
According to Statista, retail e-commerce sales amounted to approximately 5.2 trillion U.S. dollars worldwide in 2021 and show no signs of slowing down any time soon. In fact, this figure is expected to grow by 56% in the future, reaching about $8.1 trillion by 2026.
For this reason, it is imperative for e-commerce companies to be able to maximize their reach, remain competitive in such a highly saturated market, and, therefore, increase their sales. And that's exactly when the right analytics tools will prove helpful.
However, with so many business automation solutions available today, picking the right one for your business needs and objectives can be challenging. This is especially true considering that many analytics tools offer numerous features.
Whether you're considering implementing e-commerce analytics tools for your business for the first time or looking for new solutions to upgrade your current toolkit, you've come to the right place. Below, you will find our selection of the top five analytics tools that will help you boost sales. Let's dive in!
Brandly360
Brandly360 is essentially one of the most versatile and insightful tools for e-commerce monitoring available today. It allows you to collect data about prices on competitive products and their availability, as well as general competitors' product and brand positioning.
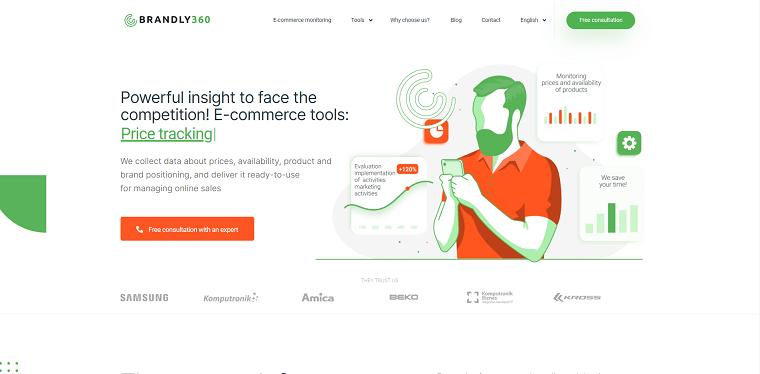
The tool then delivers reliable data in a ready-to-use form with a frequency of up to 10 minutes, taking out all the guesswork from both your pricing strategy and online sales management.
Some of this tool's most helpful features and capabilities include:
- Price and availability tracking. This allows you to manage your own distribution and pricing in accordance with the market's trends.
- Checking and evaluating the implementation of marketing activities. As a result, you can measure the effectiveness of your marketing campaigns, identify elements that need tweaking, and develop more successful strategies.
- Monitoring of competitors' promotional activities. This helps you understand if you have a competitive advantage over your competitors or how to gain market share.
- Distribution reports. Provides you with insights into the market coverage of your products compared to competitors' data.
But the list doesn't stop here. You can also monitor ad banners, get your product descriptions analyzed, monitor product reviews and ranking, and look into cross-selling monitoring. As the specialists from Brandly360 say themselves, their data analytics solutions will save up to 80% of your analytical work.
This ensures not only an insightful approach to boosting company sales but also freeing up more time for working on creative solutions.
Crazy Egg
On average, 55% of users spend fewer than 15 seconds actively on a page, so that's precisely how much time you've got to win their attention.
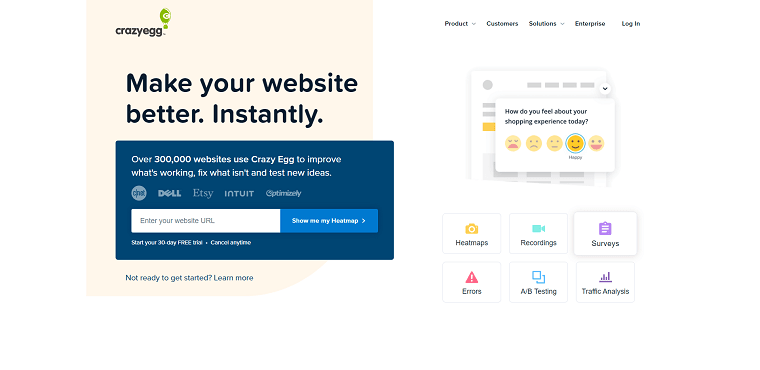
Crazy Egg is an analytics solution that focuses on building a better shopping experience for your prospects by making your website more user-friendly and client-oriented. Utilizing this tool increases user engagement and improves the performance of your website, positively affecting your sales.
As for the latter, Crazy Egg offers several methods of doing so:
- Snapshots (heatmaps). This feature takes a snapshot-in-time of your website's pages which are then interpreted by several different reports – heatmap, scrollmap, confetti, overlay, and list reports – that provide valuable insights into how customers interact with page elements and their layout.
- Recordings. You can watch recordings of actual visitors navigating through (or struggling with) your site. This helps to understand how long visitors stay on your website, which of its sections drive the most attention, and which are avoided altogether, and adjust them accordingly.
- A/B testing. A fast and easy split testing setup allows you to experiment with headlines, CTAs, and product descriptions, making continuous optimization with instant results possible. You can now choose ideas that will actually convert based on data.
- Traffic analysis. This feature allows you to analyze traffic based on specific referral sources your visitors come from and see how they perform compared to each other.
- Error tracking. An automatic error detection feature provides precise details on each error occurrence on your website, showing which of them prevent your visitors from converting and, therefore, should be addressed immediately.
- Surveys. This one is irreplaceable for getting targeted, unbiased customer feedback and measuring the customer experience, as learning what your customers want is the first step to increasing conversions.
Crazy Egg allows you to monitor customers' behavior on your website and see how they interact with it or what they expect to optimize your conversion rate.
Hotjar
Hotjar is another behavioral analytics tool that allows you to understand how your website visitors interact with your pages. It provides valuable insights into user behavior, such as what they're clicking on, how far they scroll down, where they get stuck, and so on.
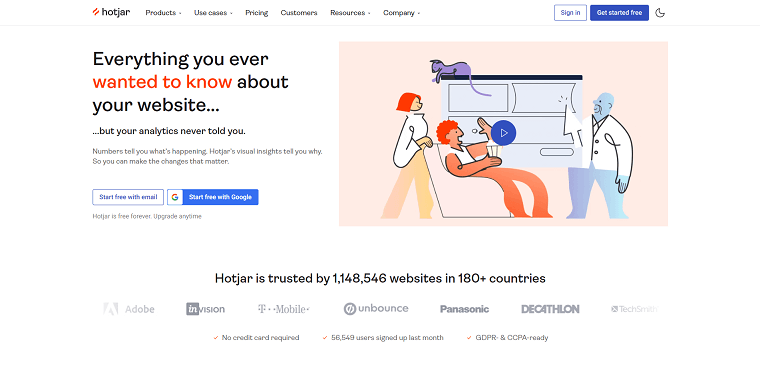
This information can be used to improve the overall user experience on your website or online store, leading to an increase in sales.
Some of the most useful features of Hotjar include the following:
- Heatmaps. This feature visualizes where users click, tap, and scroll on your website pages. You can use this data to see which areas of your website need improvement to make them more user-friendly and engaging. You can also compare desktop, tablet, and mobile interaction to see how your visitor's behavior changes depending on the platform.
- Recordings. Similarly to Crazy Egg's, these show how users interact with your website in real time, allowing you to identify any potential issues.
- Conversion funnels. Help you track conversions and see where users are dropping off your website so that you can identify and fix any issues that might be causing them to leave.
- Form analysis. It allows you to see which form fields are used most commonly and which are ignored. You can also see how long it takes visitors to fill out your forms, whether they're experiencing any difficulties, and, more importantly, why they aren't clicking the "submit" button. Straightforward and easy-to-use web forms have a significant impact on lead generation.
- Feedback polls. Help you collect feedback from your visitors directly from your site and in real-time so that you can address any issues they might be having and improve their experience.
In addition to all of these features, Hotjar offers several integrations that make it even more versatile and user-friendly. For example, you can integrate it with popular CMSs, such as WordPress, Shopify, and Wix, as well as CRMs, such as HubSpot and Salesforce.
Woopra
Woopra is a customer journey and product analytics software tool that collects data on every single customer interaction and provides holistic insights that help improve the customer experience and, as a result, increase sales.
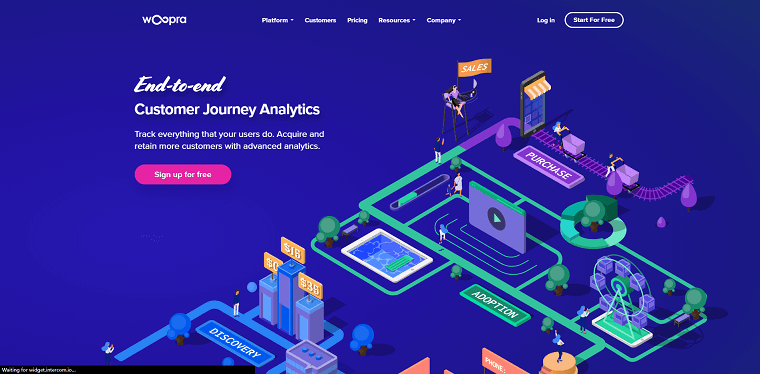
Woopra's features are designed to monitor and analyze the customer journey across all channels, devices, and touchpoints, allowing you to identify issues and optimize your marketing strategy.
Some of the analytical things this tool is capable of include:
- Journeys. Customer journey reporting helps you understand which campaigns drive your targeted audience and which ones keep them coming back. You can also evaluate how live chat affects your conversions or whether your retargeting campaign brings the desired results.
- Trends. With Trends reports, you can analyze revenue trajectory by multiple dimensions – location, subscription type, version, and more.
- Cohort reports. Analyzing the behavior of different cohorts of your visitors allows you to identify both possible obstacles and growth opportunities.
- Retention. Churn reports show you when you start losing customers, who they are, and their associated value. You can also measure the engagement rate over time and identify behaviors that drive retention.
- Behavioral segmentation. This feature allows you to create dynamic segments of users based on any criteria combination.
Woopra might seem like a lot at first, but once you're all set up, you'll be wowed by its results. Understanding how your prospects behave across product, marketing, sales, and support touchpoints allows you to create an experience that will make them not only buy from you in the first place but also keep them coming back in the future.
Google Analytics
Last but not least, Google Analytics. It is the most popular analytics tool in the world that you can use for tracking and analyzing your website's performance. It is also among the most powerful ones, as it covers all areas of e-commerce analysis and provides a wide range of features.
Google Analytics provides you with access to data and reports on traffic and visitor behavior that give valuable insights into:
- how users are finding your site and where they're coming from,
- what pages they're visiting and how long they're staying on each page,
- what actions they're taking and how many of them covert,
- overall characteristics of your site's audience.
You can use this information to improve your website or online store to generate more leads and sales, as Google Analytics' reports allow you to:
- track conversions and purchases,
- evaluate your marketing campaigns' performance and effectiveness,
- determine how to optimize your page's performance,
- identify your target audience and tailor your content and marketing efforts accordingly.
Apart from reporting and visualization, some of the key Google Analytics features include but are not limited to tag management, funnel analysis, data activation, integrations, and smart goals. The latter allows you to set specific goals and measure progress, which is essential for every e-commerce business, regardless of the industry.
Google Analytics might be deemed a default tool, but it doesn't mean it deserves less of your attention.
Takeaway
These five are the most powerful analytics tools e-commerce businesses can and should use to their advantage – you just need to choose one that fits your business's needs and objectives.
| Get Started Now to Grow Your Online Business with the Best AliExpress Dropshipping Tool - DSers! |

For instance, Crazy Egg or Hotjar will be a perfect solution if you're focusing on the website's user-friendliness, while Bradly360 will be more helpful if you're seeking ways to adjust your pricing strategy. On the other hand, Woopra and Google Analytics are best applied to your marketing efforts, bringing you in-depth analytics of your campaigns' performance.
Running a successful e-commerce business – any business – requires setting smart, realistic goals first. Once you're done with that, these five analytics tools will help you achieve them. Good luck!


 Company
 Why Choose DSers
 Blog
Blog
 Help Center


 Live Chat
